What Do We Know About Kansas City Chiefs & San Francisco 49ers Fans?
The Kansas City Chiefs will face the San Francisco 49ers in “the Big Game” this Sunday in Miami. On one side of the field, Patrick Mahomes leads the dominant aerial attack of the Chiefs, and on the other is the smashmouth zone running scheme of Kyle Shanahan’s 49ers squad. Las Vegas has the Chiefs (-1.5 points) as slight favorites, and the matchup has all the makings of an instant classic.
We aren’t football experts—we’re brand and marketing experts. So rather than dissect the gameplans of each football team, the COHN strategy team decided to use our exclusive data and insights tools to examine the fan bases of each team. Tapping into the power of the Global Web Index, we created custom audience profiles to get to know each fan base intimately.
Download the full infographic at the bottom of the blog, and let’s all hope for a great game this Sunday!
DEMOGRAPHICS
On the surface, the two fan bases are more similar than you might think. The gender split is identical, and many other cosmetic aspects are closely similar (employment status, education, net worth, etc.)
KC fans tend to be older (OK, Boomer). They are also more likely to be married. SF fans are much more likely to be urban, whereas KC fans are more likely to be rural. (Both fan bases are mostly suburban, however). And of course, SF fans are more likely to be Democrat, and KC fans are more likely to vote Republican.
Frankly, this didn’t tell us much. As with most demographics, we had to dive deeper to truly understand what makes these two fan bases distinct.
LIFESTYLE
Looking at each fan base’s behavior and lifestyle begins to paint a more complete picture of the average fan. For example, in looking at shopping habits we learn that while both fan bases love Target, KC fans are much more likely to have purchased from home improvement stores like Lowe’s or Home Depot, whereas SF fans go to department stores like Macy’s at a greater rate.
Some of the data points are pretty interesting.
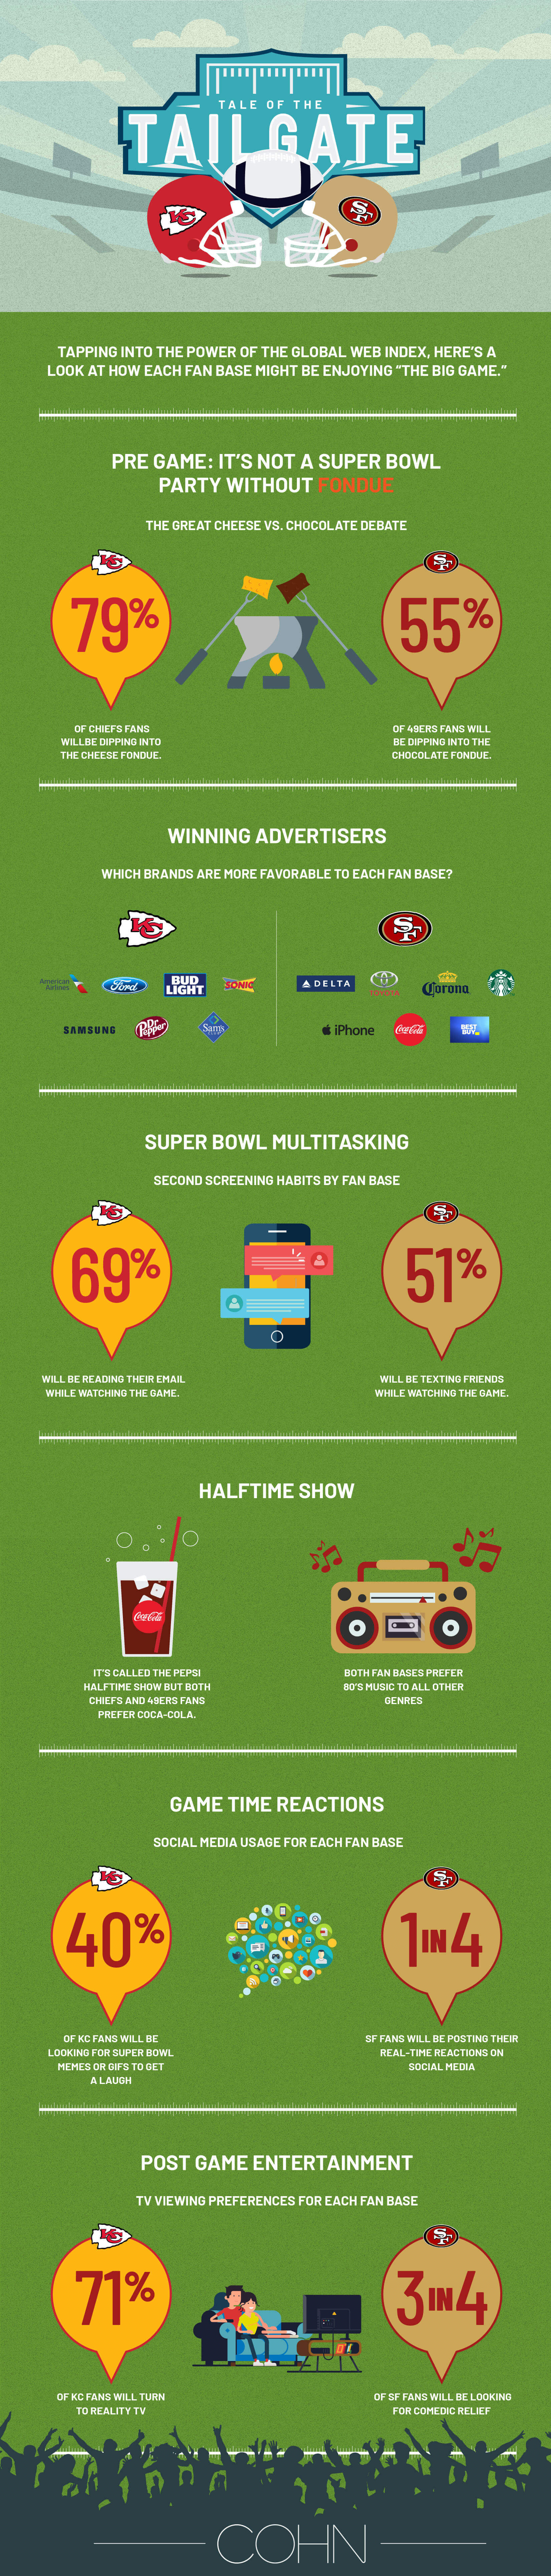
A fan at your typical 49ers Super Bowl party might arrive in their Toyota hybrid, enjoy a few Coca-Colas or Coronas throughout the game, buy score “squares” from the host via a mobile payment app, and send texts to friends on their iPhone during breaks in the game. The party might have some hip-hop playing in the background, and the snack table might even have organic fruits and vitamins.
A fan at your typical Chiefs Super Bowl party, on the other hand, probably owns a Ford, will enjoy a few Dr. Peppers or Bud Lights while noshing on cheese snacks throughout the game. They’ll be answering emails on their Samsung phone during commercial breaks as they “second screen,” and after the game, they might be tuning into their favorite reality TV show or listening to classic rock or country.
MARKETING
What most of our clients spend in a year is what these advertisers are spending per second of airtime during the Big Game. A 30-second commercial during the game is costing advertisers $5.6 million this year. Do you have $5.6 million in your advertising budget this year? Probably not.
That’s why independent marketing agencies like ours use data to learn insights about our audience base and spend budget more efficiently. If you want to reach these specific fan bases, data and insights like this are critical.
Here are a few other things we know about SF and KC fan bases as it relates to their digital behavior, marketing preferences, and customer journeys.
How do you find out about new brands and products:
- Both audiences still hear about new brands most via Ads Seen on TV (SF: 57.7%, KC: 51.6%)
- KC fans are more likely to hear about new brands from WOM recommendations from friends or family (49.9% / SF: 44.7%)\
- SF fans are more likely to hear about new brands via Ads on Public Transport (11.6% / KC: 6.9%)
What are your main reasons for using social media?
- Both audiences cite wanting to stay in touch with friends as the main reason (SF: 56.7% / KC: 55.6%)
- SF is more likely than KC to say sharing photos (38.7% / KC: 35.6%)
- SF more likely than KC to say sharing my opinion (27.8% / KC: 22.8%)
Who do you follow on social media?
- KC fans more likely to say people they know in real life (68% / SF: 65%)
- SF fans more likely to say actors (32% / KC: 26%)
What do you want brands to do?
- KC more likely to say Listen to Customer Feedback (55.7% / SF: 51%)
- SF more likely to say Support Charities (39% / KC: 31%)
What do you want brands to be?
- KC fans more likely to say Reliable (82% / SF: 78%)
SF fans more likely to say Authentic (67% / KC: 63%)
SUMMARY
If you have an audience you want to get to know better, then put our data and insights tools to the test!
We’d love to help you better articulate your brand messages to your specific audiences using data that drives smart marketing. We promise to look under the hood and find your secret formula for success—even if you’re a Patriots fan!